
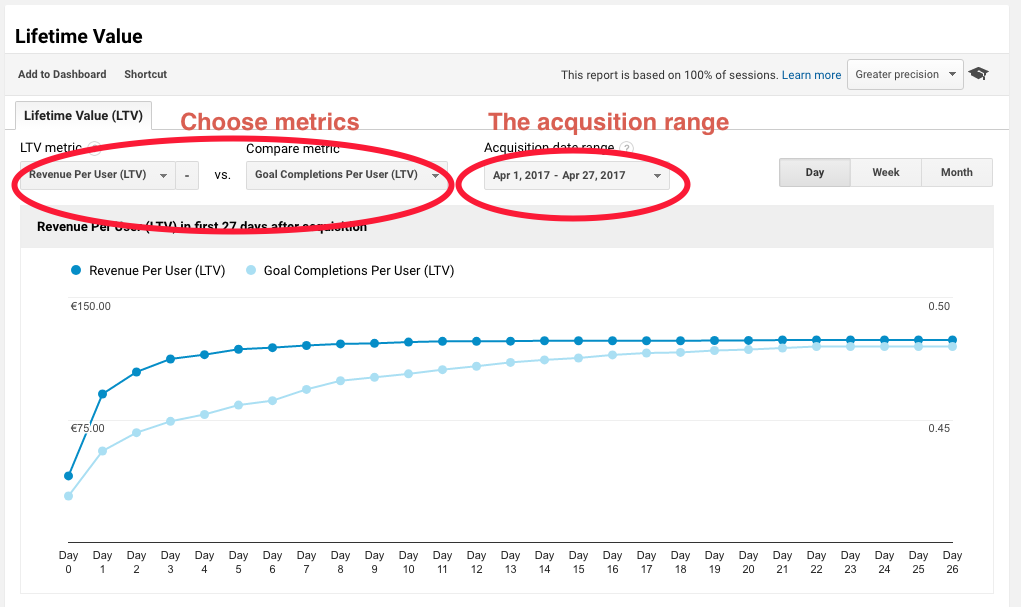
I just noticed a new report in my Google Analytics accounts: the Lifetime Value Report is a valuable addition to the existing reports. It is still in beta.
Lifetime value (LTV) reports have been missing from Google Analytics for too many years. Because of this, web analysts have used custom dimensions and custom metrics for tracking the LTV.
Now tracking the lifetime value has become a bit easier with the new lifetime value report.
You’ll find the new report in Audience > Lifetime Value.
In the report, you can compare the lifetime value based on two metrics.
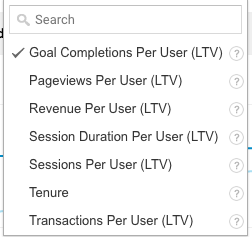
The metrics available are
- Appviews Per User
- Goal Completions Per User
- Pageviews Per User
- Revenue Per User
- Session Duration Per User
- Sessions Per User
- Transactions Per User
Of these 7 metrics, Appviews per user is available only for mobile app analytics. Google Analytics calculates these metrics simply by dividing the total metric by the number of unique users.
There are some interesting cumulative metrics here. Finally, we have an easy way to look at users (as defined by cookies) over different sessions. Unfortunately, without user identification these metrics cannot unify visitors over different browsers and devices.
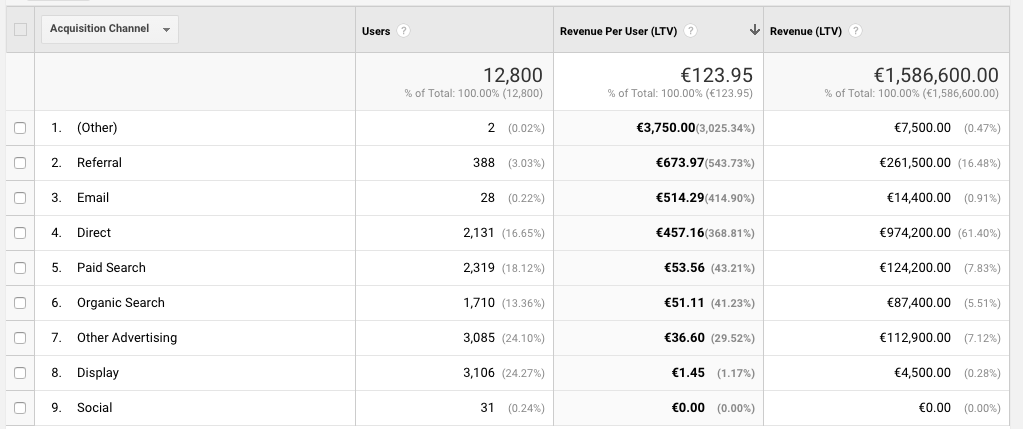
In addition, you can easily compare the LTV of users based on three different dimensions:
- channel
- source
- medium
In the lifetime value report, default channel definitions are used. In addition, the dimension is defined by the original acquisition of the user.
In the report, the data is calculated simply as the cumulative average value per user per the time increment you are using (day, week, month). You can find more information about the calculation in Google’s documentation.
Lifetime value is calculated using the cumulative sum of the metric value divided by the total number of users acquired during the acquisition date range. For example, if you acquired 100 users during the acquisition date range, then Sessions Per User is calculated as follows:
| Header | Day 0 | Day 1 | Day 2 |
|---|---|---|---|
| Cumulative sessions per day | 100 | 200 | 300 |
| Sessions per user | 100/100=1 | 200/100=2 | 300/100=3 |
Limited value in a multi-screen world
Measuring customer lifetime value is a challenge for digital marketers and analytics tools. This report is a first step in the right direction, but it certainly does not solve the problem of calculating the LTV in the multi-screen world.
Without identifying users over sessions, browsers and devices, the measured lifetime value can never be more than a first estimate of the true lifetime value. Because of this, custom dimensions, custom metrics and using the CRM or other data sources is still the method I prefer for LTV reports.