
As a reader of my new blog, you probably use Google Analytics on a weekly or daily basis like I do.
You probably know how to build dashboards and custom reports, filter Analytics views and navigate through the menus.
Even so, you might not have noticed some of the Analytics features hidden in the plain sight.
For me, it took some time (months, in some cases even years) before I noticed these tricks that make my daily work easier.
Now you can learn these 7 simple Google Analytics tips and tricks in only 3 minutes!
Weighted sort for percentage based metrics
It was a revelation for me when I first noticed the dropdown with sort type.
For example, when you try to improve your site’s bounce rate you will most probably have a look at Site Content > All Pages and sort the pages by Bounce Rate.
In most cases, you’ll find quite a few pages with 100 % bounce rate. These bounce rates are usually based only on one or two sessions.
When you change the Sort Type from Default to Weighted a new picture emerges from the data.
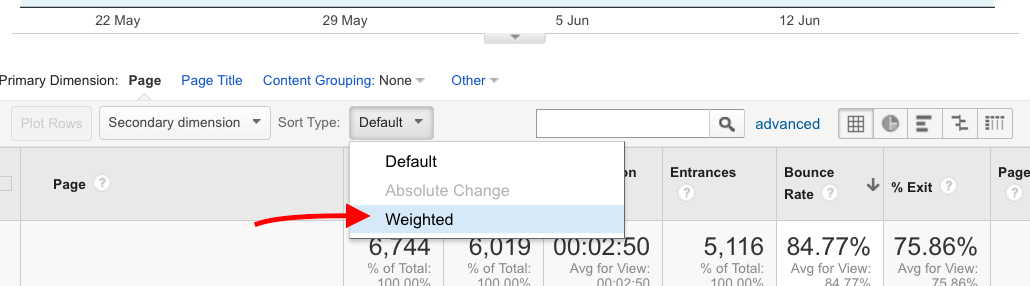
Now Google Analytics reorders the data: the weighted sort uses number of page views for weighting the sort order.
As a result of this, you’ll immediately have a better idea for where to start improving your bounce rate.
You can use the weighted sort whenever sorting rows by percentage based metrics.
If you are interested in the mathematics behind the weighted sort you should have a look at these two classic blog posts:
- Avinash Kaushik: End of Dumb Tables in Web Analytics Tools! Hello: Weighted Sort
- Peter Myers: Build Your Own Weighted Sort (GA Style)
Word clouds for reports with keyword data
Word clouds are useful for visualizing occurrences of words in a text. But did you know that also Google Analytics provides you with a simple word cloud functionality?
Google Analytics’ Term clouds are available in reports with keyword data (Search Console > Queries, Adwords > Search Queries, Adwords > Keywords).
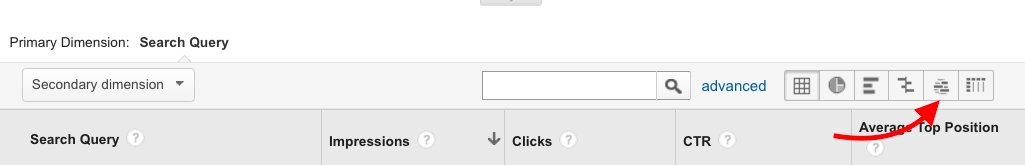
Unfortunately, the Term Clouds are not nearly as good looking as those created with some dedicated online tools.
Even so, they can give you an idea about where to look more closely.
Copy a standard report to a custom report with one click
In many reports, there is a menu item *Customise* just below the report heading.

Clicking this item creates a copy of the report as a custom report you can tweak by adding and removing table columns.
Very often, this is much faster than creating a custom report from the scratch!
Unfortunately, this feature is not available in all reports.
Plot multiple rows in a time series
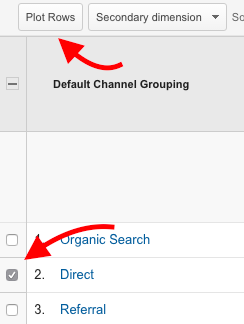 Very often, it is useful to plot metrics for different dimensions in the same graph.
You could, for example, choose to plot the organic and paid traffic in one graph omitting the other channels.
This is easy to do. Just select the rows you want to plot and click Plot Rows.
In this way, it is easy to spot common trends and trend changes in different dimensions.
In addition, there is also another, improved and well hidden way to plot rows…
Select months with one click
Every time we collect data from Analytics, we are interested in specific periods.
Because of this, the date selector is one of the most used user interface elements in Google Analytics. Still, many Analytics users never realize that calendar months can be selected with one click!
In the calendar drop down, you can just click the name of the month to select the month instead of selecting the start and end of the date range separately.

Use keyboard shortcuts
A few weeks ago I saw a tweet about keyboard shortcuts in Google Analytics.
I was shocked: it had never occurred to my mind I could use keyboard for a few very common tasks.
Just press ? to see the list of available shortcuts.

My absolute favorite is d m to select the previous month. In addition, h is definitely the easiest way to browse the Analytics documentation.
Remove the sidebar for more screen space
Do you think your screen is always full of unnecessary bloat taking up your precious screen space?
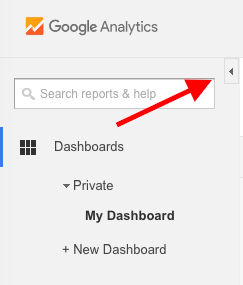 If so, you should remove the Google Analytics sidebar for some extra screen width.
You can remove the sidebar by clicking the small triangle next to the search box.
Another click will bring the sidebar back.
Even after removing the sidebar, I still prefer to use a high resolution screen with my MacBook.
And before you ask: Yes, I’m thinking about removing the sidebar also from this blog 🙂
Do you have anything to add to these features? Please share your tip using the comment box below!
8 replies on “7 simple Google Analytics tips & tricks you can use today”
Hi Mikko,
This is really very helpful information, as I was not knowing some of the features mentioned in post above. It really helped me a lot in increasing my knowledge.
Thanks
Came across this article via Google+ and it is fantastic!
Been using GA for years and like you say in the social post, even experienced users will find one or two new tricks. I certainly have!
Loving the shortcuts and weighting the %’s
Hi Stefan!
The shortcuts are really helpful — nowadays I use them all the time!
Nice article dude i have read it and also implemented in my ga-dashboard.
More over can you help me more in order to filter all my campaign.
Actually while creating utm tags some are redundant and vague those are also coming in google analytics. Can i remove those campaign tags?
Sure, only source, medium and campaign name are required fields in UTM tags. Term and content are not always needed nor are they required.
[…] viimeistään nyt analytiikan suvereeniin hallintaan. Rakastu Excelin Pivot-taulukoihin, perehdy Google Analyticsin saloihin tai hyödynnä somen analytiikkatyökalujen, kuten Rival IQ:n, ilmaisia […]
[…] 7 simple Google Analytics tips & tricks you can use today […]